
Open Access, Volume 9
Y chromosome review of the Atayal and Truku Tribes of Taiwan and their relationship with other groups of East and Island Southeast Asia
Ying-Hui Lai1; Jean A Trejaut2*
1Graduate Institute of Anatomy and Cell Biology, National Taiwan University College of Medicine.No.1 Jen Ai road section 1 Taipei 100 Taiwan R.O.C.
2Alumni Community, City Campus, University of Technology of Sydney, 15 Broadway, Ultimo, NSW 2007, Australia.
Jean A Trejaut
Alumni Community, City Campus, University of Technology of Sydney, 15 Broadway, Ultimo, NSW 2007, Australia.
Email: jtrejaut@gmail.com
Received : March 21, 2023,
Accepted : May 02, 2023
Published : May 08, 2023,
Archived : www.jclinmedcasereports.com
Abstract
Background: The Truku indigenous people of Taiwan share strong cultural and genetic relationships with the Atayal tribe. Archaeological and linguistic studies show that their line of descent is associated to Proto-Austronesian speaking groups from Southeast Asia who settled in Taiwan in the early Neolithic, 6000 years ago.
Aim: Linguist scholars are debating whether the Truku tribe is a branch of the Atayal, or whether the two tribes are separate branches of an ancestral Atayalic speaking group. Here we aim to use genetics to characterize this hypothesis.
Subjects and Methods: The Y-chromosome profile of 52 Atayal men and 20 Truku men was compared to 1,600 individuals of Taiwan and other groups of continental and insular Asia obtained from previous publications. Slowly evolving Y-chromosomal markers (Y-SNPs, n=56) and Y-chromosomal short tandem repeats (Y-STRs n=16)) were used for the analysis. The genetic relationship of the groups was characterized using Bayesian analysis of population structure (BAPS) and minimum spanning networks.
Results: While a strong affinity between Atayal and Truku was confirmed, the Truku showed a lower Y-SNP diversity than Atayal. Further, the Y-STR phylogenetic network of supra-haplogroup O1a-M119 indicated that Truku and Atayal separated approximately 5.0 kya.
Conclusions: A phylogenetic branching of the Truku and the Atayal tribes was characterized within the first millennium following the arrival of the first Austronesian speakers in Taiwan most likely from a common ancestral Atayalic speaking group.
Keywords: Population genetics; Atayal; Truku; Taiwan Aborigines; Y chromosome; BAPS; Network; mtDNA; HLA.
Abbreviations: BAPS: Bayesian Analysis of Population Structure; HLA: Histoleucocyte antigens; MDS: Multiple dimensional scaling; NRY: Non recombining Y chromosome; PCR: Polymerase chain reaction; Pingpu: Taiwan Plain dwellers; SNP: Single-Nucleotide Polymorphism; AN_Tw: Taiwan officially recognized indigenous peoples (or Taiwan Mountain tribe Aborigines); Y-STR: Y chromosome Short Tandem Repeats; kya: thousand years before present; mtDNA: Mitochondrial DNA; Tw_Han: Taiwan Han (Minnan, Hakka, and Pingpu); np (s): nucleotide position (s)
Copy right Statement: Content published in the journal follows Creative Commons Attribution License (http://creativecommons.org/licenses/by/4.0). © Trejaut JA (2023)
Journal: Open Journal of Clinical and Medical Case Reports is an international, open access, peer reviewed Journal mainly focused exclusively on the medical and clinical case reports.
Citation: Lai YH, Trejaut JA. Y chromosome review of the Atayal and Truku tribes of Taiwan and their relationship with other groups of East and Island Southeast Asia. Open J Clin Med Case Rep. 2023; 2031.
Background
The Taiwanese population (23.5 million individuals) is a multicultural society, mostly composed of Minnan and Hakka people (hereafter referred to as the Taiwanese Han or Tw_Han) originally from East and Southeast China (93.57%), and of new immigrants (3.17%) from Vietnam, Indonesia, Thailand, the Philippines, Cambodia, Japan, Korea and other parts of the world [1]. The remaining population comprises the Austronesian speaking Taiwanese (AN_Tw) previously called the Taiwan mountain tribe Aborigines (2.36%) and six Pingpu groups (< 0.8%), previously named the Taiwan plain tribes and descendants of indigenous people who remained in the western lowlands of Taiwan. The Pingpu are strongly sinicized and heavily mixed with the Tw_Han.
Archaeological, anthropological, and linguistic studies agree that the AN_Tw were Neolithic settlers who came to Taiwan from Southeast China over 6.0 kya (thousand years ago) [2,3]. Following later arrivals from East China, many AN_Tws took refuge in the central mountain ranges. In the last 400 years, more people, Han from the East and Southeast coast of China migrated to Taiwan for various commercial or agricultural activities. Most settled on the western plains of Taiwan and intermarried with autochthonous peoples to make up the present-days Pingpu groups [4,5]. During this period, the attempt of several foreign regimes to settle in Taiwan and the upcoming of modern urbanization affected the indigenous cultures [6,7]. Many minority groups in Taiwan, concerned about their cultural and genetic heritage, are claiming official recognition.
Under Japanese rules, the AN_Tw were divided into 9 tribes, but linguistics, anthropology, and archeology today characterize more disparate socio-cultural groups. For example, in Northern Taiwan, Atayal, Seediq, and Truku were initially considered to belong to a single group, the Atayal [8]. However, this classification was strongly opposed in 1996 by the East Seediq sub-ethnic group in Hualien who then formed the “Truku Name Rectification Campaign”. In 2004, based on anthropology and linguistics characteristics, the Taiwan government officially recognized them as the Truku ethnic group. Presently, Taiwan is composed of sixteen officially recognized indigenous groups or AN_TW: Amis, Atayal, Bunun, Kavalan, Paiwan, Puyuma, Rukai, Saisiyat, Sakizaya, Seediq, Thao, Truku, Tsou, Yami, Hlaalua, and Kanakanavu. Among these, Atayal, Saisiyat, and Truku have shown the highest mitochondrial DNA (mtDNA) diversity among the highland AN_Tw, suggesting these tribes might represent the earliest Austronesian speaking groups (~6.0 kya) in Taiwan [2]. Further, while some believe that the Truku (Seediq) language is a branch of Atayal language, Li classifies Atayal and Truku languages as two distinct branches arising from a common ancestral Atayalic language [9,10].
Using recent advances in molecular genetics, biologists are now able to further analyze and characterize distinct genetic relationships between ethnic groups. The admixture pattern and genetic differentiation of AN_Tw and non-AN_Tw have been broadly analyzed in the past, using maternally inherited mitochondrial DNA (mtDNA), non-recombining part of the Y-chromosome (NRY) (paternal inheritance) and Histo-leukocyte-Antigen (HLA-A, -B and -DRB1) [11-16]. In this study, we aim to use these gene systems further by focusing on the genetic differentiation and the admixture patterns between the Truku and Atayal tribes. However, we principally examine the NRY, using 56 Y-SNPs and 16 Y-STRs, and Bayesian inference of their genetic structure to characterize the impact of mixture in relation to groups surrounding Taiwan and Island Southeast Asia (Figure 1). In a later stage, the paternal inheritance is compared to previous studies using maternal inheritance (mtDNA) and diploid HLA studies.
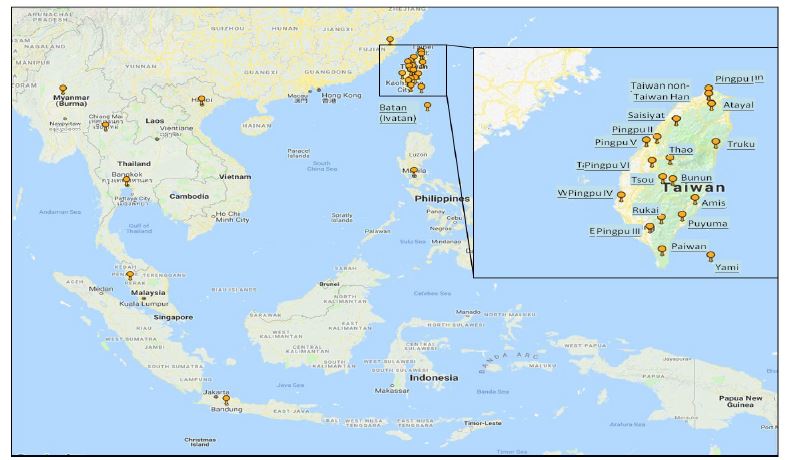
Figure 1: Geographic distribution of sampling sites.
The Atayal and Truku tribes are compared to a dataset of 1,607 Y-chromosomes from East, Southeast and island Southeast Asia. Locations on the map indicate samples collected.
Materials and Methods
DNA Samples
We analyzed 56 NRY chromosomes specific nucleotide polymorphisms (Y-SNPs haplogroups) and 16 Y-chromosomes short tandem repeats (Y-STRs haplotypes) in a sample of 258 Atayal indigenous people from the northern central mountain ranges and 64 men from the Truku tribe living on the northeast coast of Taiwan [11,15]. Individuals were unrelated, spoke either Truku or Atayal languages [11].
The Atayal and Truku indigenous people were compared to a dataset of 1,607 Y-chromosomes from East and island Southeast Asia [15]. The Y-SNPs and Y-STRs data of Atayal and Truku are shown in Supplement Table S1. Y-STRs only data for Atayal and Truku are available throught Wu et al. 2013 [11]. The corresponding HLA and mtDNA data to support our results were combined with data from multiple studies [2,5,12,14,15,17-19]. The Atayal and Truku partial and complete mtDNA genomes are shown in Supplementary Table S2.
Electrophoresis and genotyping
Y binary markers were previously typed hierarchically [15] by PCR-SSP method according to the Y chromosome phylogeny of Karafet et al [20-22].
Multiplex PCR amplification of 17 Y-STRs and Identification of mutations was done using 17 STRs (DYS19, DYS385-I, DYS385-II, DYS389-I, DYS389-II, DYSS390, DYS391, DTS392, DYS393, DYS437, DYS438, DYS439, DYS448, DYS456, DYS458, DYS635, and YGATA-H4). Note: DYS385-II was not used in our analysis as it produced double peaks [15].
Statistical analysis
Frequencies of Y-SNP haplogroups and Y-STR haplotypes in the populations were obtained by mere counting. The unbiased gene diversity index, h, and its standard error were calculated using the formulas given by Nei [23].
A multiple dimension scaling analysis plot (MDS) from NRY haplogroup frequencies determined using 56 Y-SNPs (Figure 2) was constructed with SPSS version 17.01 using Alscal and Euclidian distances (SPSS Inc., Chicago IL) [24].
Bayesian Analysis of Population Structure (BAPS version 6.0) from 16 Y-STRs was used to estimate gene flow and migration dynamics in groups of Taiwan, Continental Southeast Asia and Island Southeast Asia [25-28]. The number of groups (K) was set from 2 to 30.
To infer the relationships among haplotypes and their geographical distribution a Y-STR Median-Joining (MJ) network was constructed in the background of Y-SNP haplogroup O-M175 (excluding O1b_P31 and O2_M122), and using Network v. 4.5.1.6 (fluxus-engineering.com) then the data was processed with the reduced-median method and the STR loci weighted proportionally to the inverse of the repeat variance [29,30]. The use of ages of Y microsatellite variation of clades exclusive to Truku and Atayal was intended to provide a rough estimate of their most recent common ancestor (MRCA) and a guide for relative comparison. Estimates were obtained using the method of Zhivotovsky et al. [31] and modified according to Sengupta et al. [32] using an average mutation rate of 6.9 x 10⁻⁴ ± 5.7 x 10⁻⁴ per locus per 25 years and 16 Y-STRs.
Haplogroups age estimates for mtDNA were calculated from the complete genome variation rate of one substitution every 3,624 years using the rho statistic and corrected for purifying selection as implemented by Soares [33,34].
Atayal and Truku Y-SNP and Y-STR raw data are shown in Supplementary Table S1. MtDNA’s complete genome used for this review have been obtained from the National Center for Biotechnology Information under Genebank accession numbers EF093556; EF093539; KU131363; KU131364; AJ842746; KF540505 (Liangdao Man) and KF540506 to KF541055.
Results
Y-chromosome haplogroup O1a1a-P203 was the most common haplogroup seen in Atayal and Truku (91% and 95%, respectively) and showed the highest frequency in Taiwan or the world (Table 1 and Supplementary Table S3). The pattern of distribution of O1a1a-P203 followed a North to South decreasing gradient, showing lower frequencies among the southern AN_Tw (~47%), the Philippines, and Western Indonesia (15.6% to16.3% respectively). Haplogroup O1a1a-P203 was also seen in continental Southeast Asia (SEA) where other branches of O1a-M119 are commonly seen and where the O1a-M119 clade most likely originated.
Although, the presence of other NRY haplogroups, principally O1a-M119, O1a2-M50/M110 and O2a2b2a2-F706 were not seen (or scarce) in our Atayal and Truku data set, these haplogroups followed an increasing gradient toward the south of Taiwan, Island Southeast Asia (ISEA) and SEA (Table 1 and Supplementary Table S3). Further, haplogroup diversities (h) in Truku and Atayal were the lowest observed in Taiwan (0.17 and 0.10, respectively) compared to a range of 0.18 to 0.70 in other AN_Tws and a range of 0.62 to 0.90 in Minnan, Hakka, Pingpu, Fujian, Mainland Southeast Asia (MSEA) and Island Southeast Asia (ISEA).
Table 1: Y-SNP haplogroup frequencies of Atayal and Truku, and corresponding frequencies in neighboring populations.
| Haplogroups | Taiwan | China | Indochina | Island Southeast Asia (Malayo-Polynesian speakers) | |||||||||||||||||||||
|---|---|---|---|---|---|---|---|---|---|---|---|---|---|---|---|---|---|---|---|---|---|---|---|---|---|
| Austronesian speakers | Sinitic speakers | ||||||||||||||||||||||||
| Y-S | Pingpu: Taiwan plains dwelers1 | Taiwan Han | |||||||||||||||||||||||
| Atayal | Truku | Saisiyat | Thao | Bunun | Tsou | Paiwan | Rukai | Puyuma | Amis | Yami | Pingpu I | Pingpu II | Pingpu III | Pingpu IV | Pingpu V | Pingpu VI | Minnan and Hakka | Fujian | Akha | Thailand | Vietnam | Indonesia | Batan | Philippines | |
| O1a*_M119 | 7.6 | 6.3 | 4.9 | 24.0 | 6.9 | 13.0 | 33.3 | 4.9 | 0.7 | 11.1 | 0.3 | 1.1 | 2.7 | 4.2 | 4.9 | 41.7 | 12.3 | ||||||||
| O1a1*_P203 | 90.6 | 95.0 | 87.0 | 87.5 | 90.2 | 40.0 | 69.0 | 47.8 | 41.0 | 50.0 | 30.0 | 52.5 | 38.5 | 17.9 | 5.6 | 14.7 | 14.2 | 21.8 | 2.7 | 16.3 | 4.2 | 15.6 | |||
| O1a2_M50 | 1.9 | 4.4 | 6.3 | 60.7 | 4.9 | 28.0 | 24.1 | 21.7 | 18.0 | 6.7 | 12.5 | 16.4 | 3.6 | 0.5 | 5.3 | 16.7 | 10.7 | ||||||||
| O2a2b2a2-F706 | 5.0 | 13.0 | 35.9 | 2.5 | 1.4 | 1.3 | 1.1 | 1.8 | 6.9 | 8.3 | 17.2 | ||||||||||||||
| Others haplogroups not seen in Atayal/Truku | 0.0 | 0.0 | 8.7 | 0.0 | 39.3 | 0.0 | 8.0 | 0.0 | 4.3 | 5.1 | 16.7 | 63.3 | 35.0 | 37.7 | 76.4 | 83.3 | 83.8 | 83.2 | 76.4 | 100.0 | 94.7 | 95.8 | 66.7 | 29.2 | 44.3 |
| Total Number of Haplogroups2 | 3 | 2 | 4 | 3 | 3 | 3 | 5 | 3 | 5 | 5 | 5 | 8 | 9 | 23 | 22 | 11 | 24 | 25 | 15 | 7 | 21 | 12 | 28 | 6 | 27 |
| Sample size | 52 | 20 | 24 | 16 | 56 | 41 | 25 | 29 | 23 | 39 | 30 | 30 | 40 | 122 | 140 | 18 | 320 | 94 | 55 | 27 | 75 | 24 | 246 | 24 | 122 |
| Gene (H=Haplogroups) Diversity (Y-SNP) | 0.17 | 0.10 | 0.24 | 0.23 | 0.49 | 0.18 | 0.70 | 0.46 | 0.69 | 0.67 | 0.63 | 0.81 | 0.69 | 0.81 | 0.88 | 0.88 | 0.88 | 0.90 | 0.87 | 0.62 | 0.87 | 0.88 | 0.86 | 0.73 | 0.89 |
| ± SD (Nei et al.1987) | 0.05 | 0.06 | 0.08 | 0.10 | 0.02 | 0.06 | 0.03 | 0.06 | 0.05 | 0.02 | 0.04 | 0.02 | 0.05 | 0.02 | 0.01 | 0.02 | 0.01 | 0.01 | 0.01 | 0.06 | 0.02 | 0.02 | 0.01 | 0.04 | 0.01 |
| Total Number of Y-SNP-STR Haplotypes | 35 | 12 | 12 | 6 | 34 | 10 | 21 | 22 | 23 | 27 | 16 | 18 | 21 | 88 | 92 | 12 | 267 | 88 | 47 | 21 | 53 | 24 | 206 | 20 | 115 |
| Gene (h=haplotypes) Diversity (± SD ≤ 0.01) | 0.98 | 0.89 | 0.90 | 0.68 | 0.98 | 0.78 | 0.99 | 0.98 | 1.00 | 0.99 | 0.94 | 0.96 | 0.96 | 0.99 | 0.99 | 0.99 | 1.00 | 1.00 | 1.00 | 0.97 | 0.99 | 1.00 | 1.00 | 0.98 | 1.00 |
1. Location of Pingpu I to VI are indicated in Figure 1;
2. number of haplogroups shared and unshared
3. A blank space indicates an Atayal or Truku haplogroup not seen in this group
A multidimensional scaling plot (Figure 2) was constructed using Euclidean distances obtained from the high definition Y-SNP haplogroup frequencies with SPSS version 17.01 (SPSS Inc., Chicago IL). All AN_Tws and most Pingpu groups were located on the right of the MDS plot, with the northern AN_Tws (Atayal, Truku, and Saisiyat) and central AN_Tws (Thao and Tsou) tightly clustered on the far right. The southern AN_Tw tribes were closer to the center. This pattern supports the frequency results shown in Table 1 and Supplementary Table S3 where more Continental Asian gene flow is going into the Southern AN_Tws than among the Northern AN_Tw. Further, non-aboriginal Taiwanese groups (Minnan and Hakka), and some Pingpu groups, (Pingpu IV, Pingpu V, and Pingpu VI) were found on the center-left of the plot in proximity to Continental Asian groups, suggesting significant male introduction from Continental Asians into the already heavily sinicized Pingpu groups.
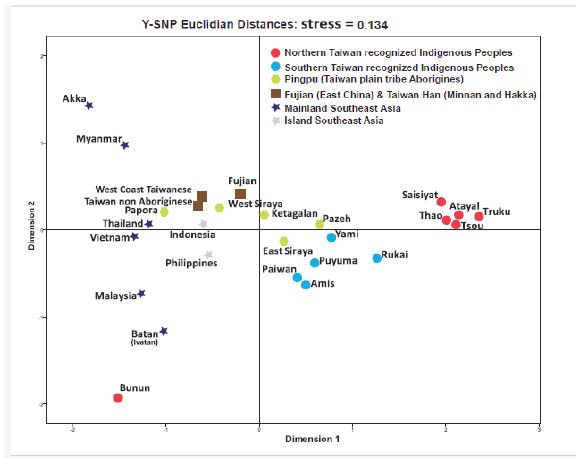
Figure 2: Multidimensional scaling plot using Y-SNP genotypic data.
Atayal and Truku are clustered on the right with the northern and central indigenous tribes of Taiwan except with the Bunun which outlier position is due to the high frequency of O1a2, the absence of O1a-M119, O1a1a-P203, and an important amount of "other haplogroups not seen in Atayal, Truku, and other AN_Tw tribes (Table 2).
The BAPS analysis
The mixture analysis plot obtained from BAPS divided the populations into ten groups (Supplementary text 1 and Supplementary Figure S1). As expected from high genetic diversity (Table 1), most clusters presented an indication of genetic structure, except for cluster-one, comprising Atayal and Truku and showing genetic homogeneity. Accordingly, a minimum spanning network was constructed to test the apparent genetic homogeneity seen for Atayal and Truku (cluster 1, Supplementary Figure S1), and to investigate their relationship with other populations of East Asia. Since haplogroup O1a1a-P203 is the most common Y-SNP haplogroup among the Taiwan mountain tribes (Table 1) and is a subtype of supra-haplogroup O1a-M119, the spanning network included all Y-STR haplotypes belonging to supra-haplogroup O1aM119 in Taiwan, ISEA, SEA, and MSEA (Figure 3A). The high haplotype diversities and frequencies of haplogroup O1a1a-P203 seen in Atayal and Truku (Table 1) are indicators of local genetic structure, and local expansion. Furthermore, the high haplotype diversities seen among other AN_Tw support the high number of groups specific haplotype clusters found within the O1a1a-P203 spanning network. As seen in our BAPS primary results (Supplementary Figure S1), the spanning network also identified Atayal and Truku into a cluster distinct from all others (Figure 3C). Moreover, this cluster showed several secondary clades that were exclusive to either Atayal or Truku and shared the same most recent common ancestor (MRCA). Corroborating these results, the unrooted UPGMA tree (Figure 3B) emphasized the close relationship between Atayal and Truku and exhibited genetic structures in concordance with the Y-STR haplotypes Network.
We used the modified coalescence method of Zhivotosky and Sengupta to calculate the time of divergence [31,32]. Our results indicate that the genetic differentiation of Y haplogroup O1a1a-P203 in the clade containing Atayal and Truku (Figure 3C) occurred approximately 5.8 Kya and likely represent the original time of settlement of Proto-Atayalic group in the northern Mountain range of Taiwan. Moreover, these results also suggest that Atayal and Truku most likely separated a millennium later (5.0 Kya), and remained isolated from each other and other AN_Tw until the present time.
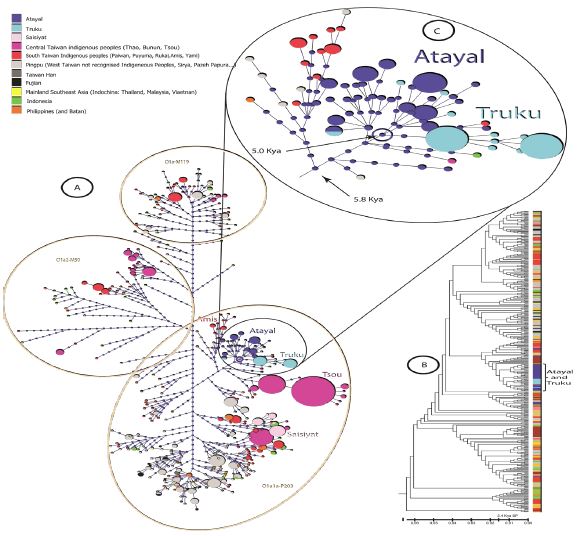
Figure 3: O1a-M119 Y-haplogroup network of Atayal, Truku indigenous peoples and other Taiwan and East Asian populations.
Hierarchical origin of Atayal and Truku groups
All clusters previously determined by the BAPS analysis (Supplementary Figure S1) showed self-looping arrows varying from 67% to 93% (Figure 4). This indicates that the major ancestral genetic source of each cluster is self-contained and most likely associated with the length of isolation, cohabitation or separation of the groups forming this cluster. While the analysis does not inform about the directional gene flow between groups within a cluster, the self looping arrow is a strong indicator of the affinity between the Atayal and Truku tribes (93%, cluster 1).
The levels of gene flow within clusters (67% to 93%) contrasted significantly with the proportions of gene flow seen between clusters (< 5%) [35]. It can be estimated that 3% of the paternal genome of Atayal and Truku was introduced from Saisiat and 4% from other sources in Taiwan.
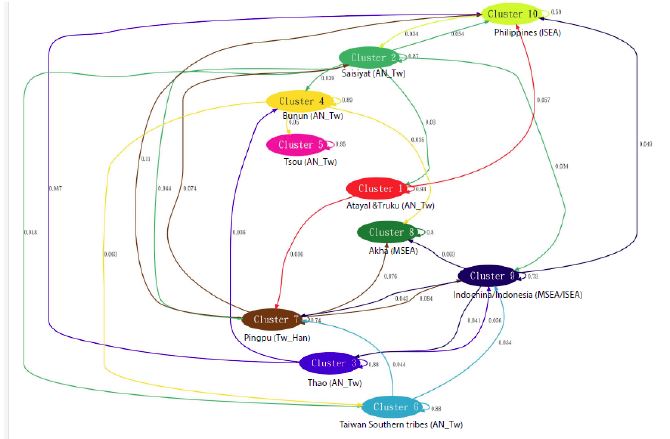
Figure 4: Gene flow between tribes.
To investigate the ancestral mixture of Atayal and Truku one looks at all the arrows pointing at it. Cluster 1 contains its own genetic makeup (93%), denoted as a self-looping arrow, and receive 3% of Y-DNA introduced via gene flow from Saisiyat, and 4% from other populations. This pattern indicates long isolation of the Atayal and Truku tribes from other groups in Taiwan.
Geographic distribution of the genetic profile
The spatial clustering module of the BAPS software version 6.0 was used to enable a three-dimensional representation of the clustering of the NRY genetic data according to the geographical coordinates of the groups. In Figure 5, each cell tessellations corresponds to the physical neighborhood of a set of observed data points and is colored according to its cluster membership as previously determined above in the Network analysis (Figure 3). The height of the surface of each tessellation cell can be estimated from the vertical axis and represent the “Local uncertainty” of the geographical position of the clusters [36,25]. Most cells had a local uncertainty lower than 0.001 indicating our genetic data was reliable [25], and except for the Myanmar and Puyama groups, we observed well-characterized genetic continuity between all neighboring regions.
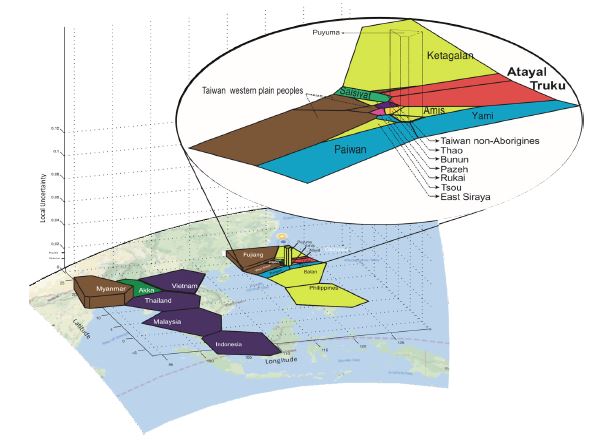
Figure 5: Three-dimensional geographic distribution of the genetic structure using 16 Y-STRs data.
Colors identify ten population genetic clusters (1 to 10 as in Supplementary Figure S1). The values shown on the vertical axis represent the local uncertainty. Only Myanmar and Puyuma groups have local uncertainty greater than 0.01. Genetic continuity is seen in peninsular Southeast Asia (Indochina) and in Island Southeast Asia, including Taiwan (enlarged in the insert). Interestingly, Indonesia shows more affinity with peninsular Asia.
Discussion
Linguists generally agree that the Truku (Seediq) and Atayal languages are separate branches of the Atayalic group of languages [9,10,37]. Similarly, the cultures of these tribes have been affected by social modernization and became very different [8]. Although Atayal and Truku were officially recognized as separate people in 2004 [1], the Truku people were initially classified as a sub-branch of the Atayal tribe and it is sometimes still debated whether the Truku tribe is a sister or a sub-branch of the Atayal tribe. To answer this question genetically, a collection of Y-chromosomal SNP haplogroups and Y-STR haplotypes representing ethnic groups from East Asia, Taiwan, and the Philippines, were genotyped and analyzed. The analysis of NRY lineages revealed several traits characterizing the Atayal and Truku groups, namely:
the pairwise Y-SNP homogeneity seen among all AN_Tw speaking groups was the highest between Atayal and Truku.
_Y-STR haplotypes within the Atayal and Truku group were rarely shared and belonged to a set of sister clades exclusive to the tribe.
_the Atayal and Truku tribes likely separated early (within the first millennium) after the arrival of the first Austronesian speakers in Taiwan.
Atayal and Truku showed similar Y-SNP haplogroup profiles with haplogroup O1a1a-P203 being the most prevalent in the Atayal and Truku compared to other Taiwan groups or any other group worldwide (91% and 95% respectively) (Table 1). On the other hand, Y-STR haplotypes between the two tribes were very distinct (Figure 3), despite their geographical proximity. We note that when using conjointly the results from Y-SNP haplogroups and Y-STR haplotypes (Figure 3) it was generally possible to assign most Atayal and Truku participants to their respective tribes univocally. It follows that the rare Y-STR haplotypes shared between Atayal and Truku (only two) most likely represented a recent gene flow due to their proximity. This distribution landscape may be explained as being the result of a long period of isolation and the use and conservation of different intitial languages, and shows how cultures are redefined and practiced differently when in separate local contexts [8]. For example, among the western plain tribes of Taiwan, where Sinicization is high as the result of Han migration in the course of the last 400 years [4,5], it was not uncommon to find participants, who claimed a Han ancestry, when actually they were genetically featuring a paternal ancestry from SEA/Han and a AN_Tw maternal ancestry or vice versa, and less often, had both parents belonging to a AN_Tw group [15].
The overall age estimates of haplogroup O1a1a-P203 in Atayal and Truku was 5.8 ± 1.6 kya and 4.8 ± 1.8 kya respectively [38]. These estimates coincide broadly with the Austronesian expansion time (5 to 6 KY) [39]. Accordingly, Atayal and Truku appeared to have separated very early from a common ancestral gene pool that was brought upon by the first seafaring Proto-Austronesian agriculturists, most likely within the first millennia after their arrival in Taiwan, approximately 5.0 ± 1.6 kya (Figure 3).
A set of K=10 clusters was retained in the BAPS analysis as it gave the most meaningful information and clear separation of all ethnic groups (Supplementary Figure S1). Atayal and Truku were retained in the same cluster groups (Cluster-1; Supplementary Figure S1) and gave the appearance of a homogenous group. Contrasting with their low haplogroup diversities and the high frequency of O1a1a-P203, only two individuals in Truku and Atayal shared their Y-STR haplotypes, and all AN_Tw groups had high haplotype diversity (~0.9; Table 1 and Supplementary Table S3). Such results are the characteristics of genetically structured groups and most likely indicate the sharing of ancestry (same haplogroup), separate long isolation of the two tribes, hence no gene flow between them (scarce sharing of Y-STR haplotypes).
The construction of a minimum spanning network using all haplotypes of the Y-SNP O1a-M119 family of haplogroups produced clades generally exclusive to each population group and was in line with the groups previously determined with BAPS. Within the cluster containing Atayal and Truku (Figure 3C), all haplotypes (but two) belonged to Y-SNP haplogroup O1a1a-P203. The node indicating a MRCA of 5.0 kya is most likely the MRCA of the two tribes. The high number of twigs and the complex network emerging from this node indicates continuous expansion of the tribes since the time of separation and is in line with the high haplotype diversity results shown in Table 1.
The Gene flow between tribes analysis conducted by the BAPS software [25] regrouped the eleven Taiwan aboriginal tribes into seven homogeneous population clusters which showed a within-group paternal variation ranging from (87%-97%) (Figure 4). The genetic differentiation observed in Cluster 1 (Atayal and Truku) was the second highest of all the clusters (93%). This high genetic variation aligns with the hypothesis based on the coalescent time estimate of haplogroup O1a1a-P203 (Figure S3). It suggests an early arrival of a unique proto-Atalayalic ancestral group in early Neolithic (5.8 Kya) and separation of the tribes within the next milinium. Such an early period of separation and long isolation in locations difficult to access would have favored within-group marriages and separate cultural developments that ended up into two well-characterized ethnic identities. Further, most AN_Tw populations occupy a heterogeneous landscape in the central mountain range of Taiwan that could have lead to a complex pattern of gene flow among local populations, nonetheless, the spatial distribution of the genetic profile (Figure 5) showed that local uncertainty in most tribes was lower than 0.001. This indicates that our data was reliable [25] in characterizing historical genetic continuity between the Atayal and Truku tribes.
Corroborating the Y chromosome analysis, the mtDNA phylogeographic distribution of haplogroups M7b1a2a (np 16,324 and np 4454) (Supplementary Figure S2) shows a clear separation of AN_Tws with M7b1a2a1b in the North and a branch of M7b1a2a1a among southern AN_Tw dating approximately 3.8 kya. This difference is even more noticeable in the Philippines where M7b3 is scarce but subtypes of M7c are more prominent [16,40-44]. Similarly, Brandao [45] suggested an early Holocene dispersal of mtDNA haplogroup F4b1 (np T10097C) from Mainland Southeast Asia (Supplementary Figure S3). In Taiwan, haplogroups F4b1 (np T10097C) shows a coalescence age estimate of 4.32 kya (CI 1.29-7.28 kya), it is most commonly seen among AN_Tws, but scarce in the Philippines [13]. Supplementary Figure S3 shows that most branches of F4b1 are seen among the northern and central AN_Tw (Atayal, Truku, Saisiyat, Bunun, Thao, Tsou, and Amis) [2,12] with F4b1c seen principally among Atayal.
Finally, more support to the pattern of distribution just described by Y and mitochondrial DNA analysis, is brought by the HLA gene system (Supplementary Text 1) which allowed differentiating non-AN_Tw from Minnan, Hakka and Pingpu groups, and suggested the occurrence of recent gene flow between these groups [4,14,18].
Conclusion
Many scholars in the past have debated that language and culture can be the standards to distinguish an indigenous group from another [8]. Here, the conjoint minimum spanning network and Bayesian Analysis approaches [25,46] allowed us to disclose clear genetic clusters that identified the Atayal and Truku tribes as two isolated groups showing spatial continuity between them. The Y-STR network of O1a1a-P203 indicated that Truku and Atayal branched from each other very early after their initial settlement in Taiwan (5 to 6 ± 2.2 kya), most likely, and in line to the linguistic hypothesis [9], from a genetically homogeneous group of speakers of the ancestral Atayalic language. Finally, this study corroborates previous reports of mtDNA profiles with the sharing between Atayal and Truku of mtDNA haplogroups M7b1a2a and F4b1, and the sharing of HLA alleles HLA-A*24:02, and A*24:20, HLA-B*39:01 and B*40:01, and HLA-DRB1* 08:03, DRB1*11:01 and DRB1*14:01 [4,14,18].
Declarations
Ethics approval and consent to participate: Not needed for this review as all data is publicly available.
Availability of data and materials: NRY SNPs and STRs for the Atayal and Truku tribe are shown in supplementary Table S1. NRY Y-STR and Y-SNP data sets from other groups in Taiwan are available from Trejaut [15] and Wu 2013 [11]. The complete mtDNA genome data used for the construction of phylogenetic trees shown as supplementary material have been obtained from GenBank under the following accession numbers: KU131363; EF093556; EF093539; AJ842746; KF540505 (Liangdao Man) and KF540506-KF541055.
Competing interests: The authors declare that they have no competing interests.
Funding: No funding.
Authors’ contributions: The project was conceived and designed by JAT. The laboratory work was performed by YHL. YHL and JT performed data analysis and drafted the manuscript.
Acknowledgments: The authors wish to thank Charmaine Greenwell (M.Sc.; Dip. Diet) for revising the final work.
References
- MOI. Department of Statistics, Ministry of the Interior, Monthly Bulletin of Interior, Taiwan 2016, http://sowf.moi.gov.tw/stat/year/elist.htm (Taipei, Taiwan: Ministry of the Interior, Taiwan). 2016.
- Ko AM, Chen CY, Fu Q, Delfin F, Li M, et al. Early Austronesians: into and out of Taiwan. Am J Hum Genet. 2014; 94: 426-436.
- Lum JK, Cann RL, Martinson JJ, Jorde LB. Mitochondrial and nuclear genetic relationships among Pacific Island and Asian populations. Am J Hum Genet. 1998; 63: 613-624.
- Lin M, Chu CC, Chang SL, Lee HL, Loo JH, et al. The origin of Minnan and Hakka, the so-called “Taiwanese”, inferred by HLA study. Tissue Antigens. 2001; 57: 192-199.
- Lin M, Chu CC, Lee HL, Chang SL, Ohashi J, et al. Heterogeneity of Taiwan’s indigenous population: possible relation to prehistoric Mongoloid dispersals. Tissue Antigens. 2000; 55: 1-9.
- Chiu H. The colonial “civilizing process” in Dutch Formosa 1624-1662. The colonial “civilizing process” in Dutch Formosa 1624-1662. Publ. TANAP/IGEER, Fac. Arts, Leiden Univ. 2007.
- Andrade T. How Taiwan Became Chinese: Dutch, Spanish and Han Colonization in the Seventeenth Century. Publ. by Columbia Univ Press. 2008.
- Wang M. The Reinvention of Ethnicity and Culture: A Comparative Study on the Atayal and the Truku in Taiwan. J Archaeol Anthr. 2008; 1-44.
- Li PJ. Reconstruction of proto-Atayalic phonology. Bulletin of the Institute of History and Philology. Li, Paul Jen-Kuei. 2004. Sel. Pap. Formos. Lang. Taipei, Taiwan Inst. Linguist. Acad. Sin. 1981.
- Li PJ. Atayalic final voiced stops. Tracking the Travellers,Pacific Linguistics. Third Int. Conf. Austronesian Linguist. 1982; 2: 171-185.
- Wu FC, Chen MY, Chao CH, Pu CE. Study on the genetic polymorphisms of Y chromosomal DNA short tandem repeat loci applied to analyzing the relative affinities among ethnic groups in Taiwan . Forensic Sci Int Genet Suppl Ser. 2013; 4: e69–e70.
- Trejaut JA, Kivisild T, Loo JH, Lee CL, He CL, et al. Traces of archaic mitochondrial lineages persist in Austronesian-speaking Formosan populations. PLoS Biol. 2005; 3.
- Tabbada KA, Trejaut J, Loo JH, Chen YM, Lin M, et al. Philippine mitochondrial DNA diversity: a populated viaduct between Taiwan and Indonesia? Mol Biol Evol. 2010; 27: 21-31.
- Chu CC, Lin M, Nakajima F, Lee HL, Chang SL, et al. Diversity of HLA among Taiwan’s indigenous tribes and the Ivatans in the Philippines. Tissue Antigens. 2001; 58: 9-18.
- Trejaut JA, Poloni ES, Yen JC, Lai YH, Loo JH, et al. Taiwan Y-chromosomal DNA variation and its relationship with Island Southeast Asia. BMC Genet. 2014; 15: 77.
- Lin M, Chu CC, Broadberry RE, Yu LC, Loo JH, et al. Genetic diversity of Taiwan’s indigenous peoples: possible relationship with insular Southeast Asia. In: Sagart, L.; Blench, R.; Sanchez-Mazas, A., eds. “The Peopling of East Asia: Putting Together Archaeology, Linguistics and Genetics.” Routledge Curzon, London New York. 2015; 230-247.
- Loo JH, Trejaut JA, Yen JC, Chen ZS, Lee Cl, et al. Genetic affinities between the Yami tribe people of Orchid Island and the Philippine Islanders of the Batanes archipelago. BMC Genet. 2011; 12: 21.
- Chu CC, Lee HL, Trejaut J, Chang HL, Lin M. HLA-A, -B, -Cw and -DRB1 allele frequencies in Ami, Atayal, Bunun. Hakka, Paiwan, Pazeh, Puyuma, Rukai, Saisiat, Tsou, Taroko, Thao and Tao populations from Taiwan. Hum. Immunol. Spec. Issue HLA Alleles Other Immunogenet. Polymorph. Freq. from World Wide Popul. Guest Ed. Derek Middelton, John Sanil Manavalan, Marcelo A. Fernandes-Vina. ASHI. 2004; 65: 1102-1181.
- Liu C, Xing H, Su S. [Molecular epidemiological study on HIV-1 infection in Shandong Province]. Zhonghua Shi Yan He Lin Chuang Bing Du Xue Za Zhi. 2000; 14: 231-235.
- Karafet TM, Mendez FL, Meilerman MB, Underhill PA, Zegura SL, et al. New binary polymorphisms reshape and increase resolution of the human Y chromosomal haplogroup tree. Genome Res. 2008; 18: 830-838.
- YCC. A Nomenclature System for the Tree of Human Y-Chromosomal Binary Haplogroups. Genome Res, Cold Spring Harb. Lab. Press. 2002; 339-348.
- Kaessmann H, Wiebe V, Weiss G, Paabo S. Great ape DNA sequences reveal a reduced diversity and an expansion in humans. Nat Genet. 2001; 27: 155-156.
- Nei M. Molecular evolutionary genetics (New York: Columbia University Press). 1987.
- SPSS. SPSS Inc. Released 2008. SPSS Statistics for Windows, Version 17.0. Chicago SPSS Inc. 2008.
- Corander J, Marttinen Pekka Sirén J, Tang J. Enhanced Bayesian Modelling in BAPS Software for Learning Genetic Structures of Populations. BMC Bioinformatics. 2008; 9: 539.
- Andrade-Souza V, Silva JG, Hamada N. Phylogeography and population diversity of Simulium hirtipupa Lutz (Diptera: Simuliidae) based on mitochondrial COI sequences. PLoS One. 2017; 12: e0190091.
- Kutanan W, Kampuansai J, Srikummool M, Kangwanpong D, Ghirotto S, et al. Complete mitochondrial genomes of Thai and Lao populations indicate an ancient origin of Austroasiatic groups and demic diffusion in the spread of Tai-Kadai languages. Hum Genet. 2017; 136: 85–98.
- Boattini A, Martinez-Cruz B, Sarno S, Harmant C, Useli A, et al. Uniparental markers in Italy reveal a sex-biased genetic structure and different historical strata. PLoS One. 2013; 8: e65441.
- Bandelt HJ, Dress AWM. Split Decomposition: A new and useful approach to phylogenetic analysis of distance data. Mol. Phylogenet. Evol. 1992; 242-252.
- Bandelt HJ, Forster P, Sykes BC, Richards MB. Mitochondrial portraits of human populations. Genetics. 1995; 743-753.
- Zegura SL, Karafet TM, Zhivotovsky LA, Hammer MF. High-resolution SNPs and microsatellite haplotypes point to a single, recent entry of Native American Y chromosomes into the Americas. Mol Biol Evol. 2004; 21: 164-175.
- Sengupta S, Zhivotovsky LA, King R, Mehdi SQ, Edmonds CA, et al. Polarity and temporality of high-resolution y-chromosome distributions in India identify both indigenous and exogenous expansions and reveal minor genetic influence of Central Asian pastoralists. Am J Hum Genet. 2006; 78: 202-221.
- Saillard J, Forster P, Lynnerup N, Bandelt HJ, Norby S. mtDNA variation among Greenland Eskimos: the edge of the Beringian expansion. Am J Hum Genet. 2000; 67: 718-726.
- Soares P, Ermini L, Thomson N, Mormina M, Rito T, et al. Correcting for purifying selection: an improved human mitochondrial molecular clock. Am J Hum Genet. 2009; 84: 740-759.
- Tang J, Hanage WP, Fraser C, Corander J. Identifying currents in the gene pool for bacterial populations using an integrative approach. PLoS Comput Biol. 2009; 5: e1000455.
- Corander J, Marttinen P, Mäntyniemi S, Corrander J, Marttinen P, et al. A Bayesian Method for Identification of Stock Mixtures from Molecular Marker Data. Fish. Bull. 2006; 104: 550-558.
- Lee AP. Dorsal Consonant Harmony in Truku Seediq. Lang. Linguist. 2009; 569-591.
- Zhivotovsky LA, Underhill PA, Cinnioglu C, Kayser M, Morar B, et al. The effective mutation rate at Y chromosome short tandem repeats, with application to human population-divergence time. Am J Hum Genet. 2004; 74: 50-61.
- Gray RD, Drummond AJ, Greenhill SJ. Language Phylogenies Reveal Expansion Pulses and Pauses in Pacific Settlement. Science. 2009; 323: 479-483.
- Delfin F, Min-Shan Ko A, Li M, Gunnarsdottir ED, Tabbada KA, et al. Complete mtDNA genomes of Filipino ethnolinguistic groups: a melting pot of recent and ancient lineages in the Asia-Pacific region. Eur J Hum Genet. 2014; 22: 228-237.
- Horai S, Hayasaka K. Intraspecific nucleotide sequence differences in the major noncoding region of human mitochondrial DNA. Am J Hum Genet. 1990; 46: 828-842.
- Soares PA, Trejaut JA, Rito T, Cavadas B, Hill C, et al. Resolving the ancestry of Austronesian-speaking populations. Hum Genet. 2016; 135: 309-326.
- LIN M, CHU CC, BROADBERRY RE, Yu LC, Loo JH, Trejaut, et al. Genetic diversity of Taiwan’s indigenous peoples: possible relationship with insular Southeast Asia (In: The Peopling of East Asia. Putting together archeology, linguistics and genetics.Pub. RoutledgeCurszon, Taylor and Francis group; London and New York. 2005; 230-245.
- Kivisild T, Tolk HV, Parik J, Wang Y, Papiha SS, et al. The emerging limbs and twigs of the East Asian mtDNA tree. Mol Biol Evol. 2002; 19: 1737-1751.
- Brandao A, Eng KK, Rito T, Cavadas B, Bulbeck D, et al. Quantifying the legacy of the Chinese Neolithic on the maternal genetic heritage of Taiwan and Island Southeast Asia. Hum Genet. 2016; 135: 363-376.
- Bandelt HJ, Forster P, Rohl A. Median-joining networks for inferring intraspecific phylogenies. Mol Biol Evol. 1999; 16: 37-48.
- Yao YG, Kong QP, Bandelt HJ, Kivisild T, Zhang YP. Phylogeographic differentiation of mitochondrial DNA in Han Chinese. Am J Hum Genet. 2002; 70: 635-651.